Increasing patient's awareness through health education
A healthcare product focused on treating chronic illness through
gut-microbiome and DNA testing


Healthcare
San Francisco
40-50
Problem
Digbi Health uses Precision Biology to Treat and Prevent Chronic Illnesses Link: https://www.digbihealth.com
Our challenge: Boost patient awareness and engagement. How might we increase in-app engagement and increase patient awareness to increase motivation of interactions with health coaches?
My Role
UX Design | Building Wireframes & Prototypes | Coordinating with Product Manager, data analysts, care specialists, UI designers, & content writers
23%
47%
67
Design Directions
Due to the low retention rates and declining rate of daily active users, we explored various sections of the app that required an improvement.
Redesigning Health Education | Enhancing Coaching Module | Patient Data-collection
This particular case study will only focus on how I redesigned health education by prioritizing patient's need of awareness of Digbi's scientific approach for managing chronic illnesses.

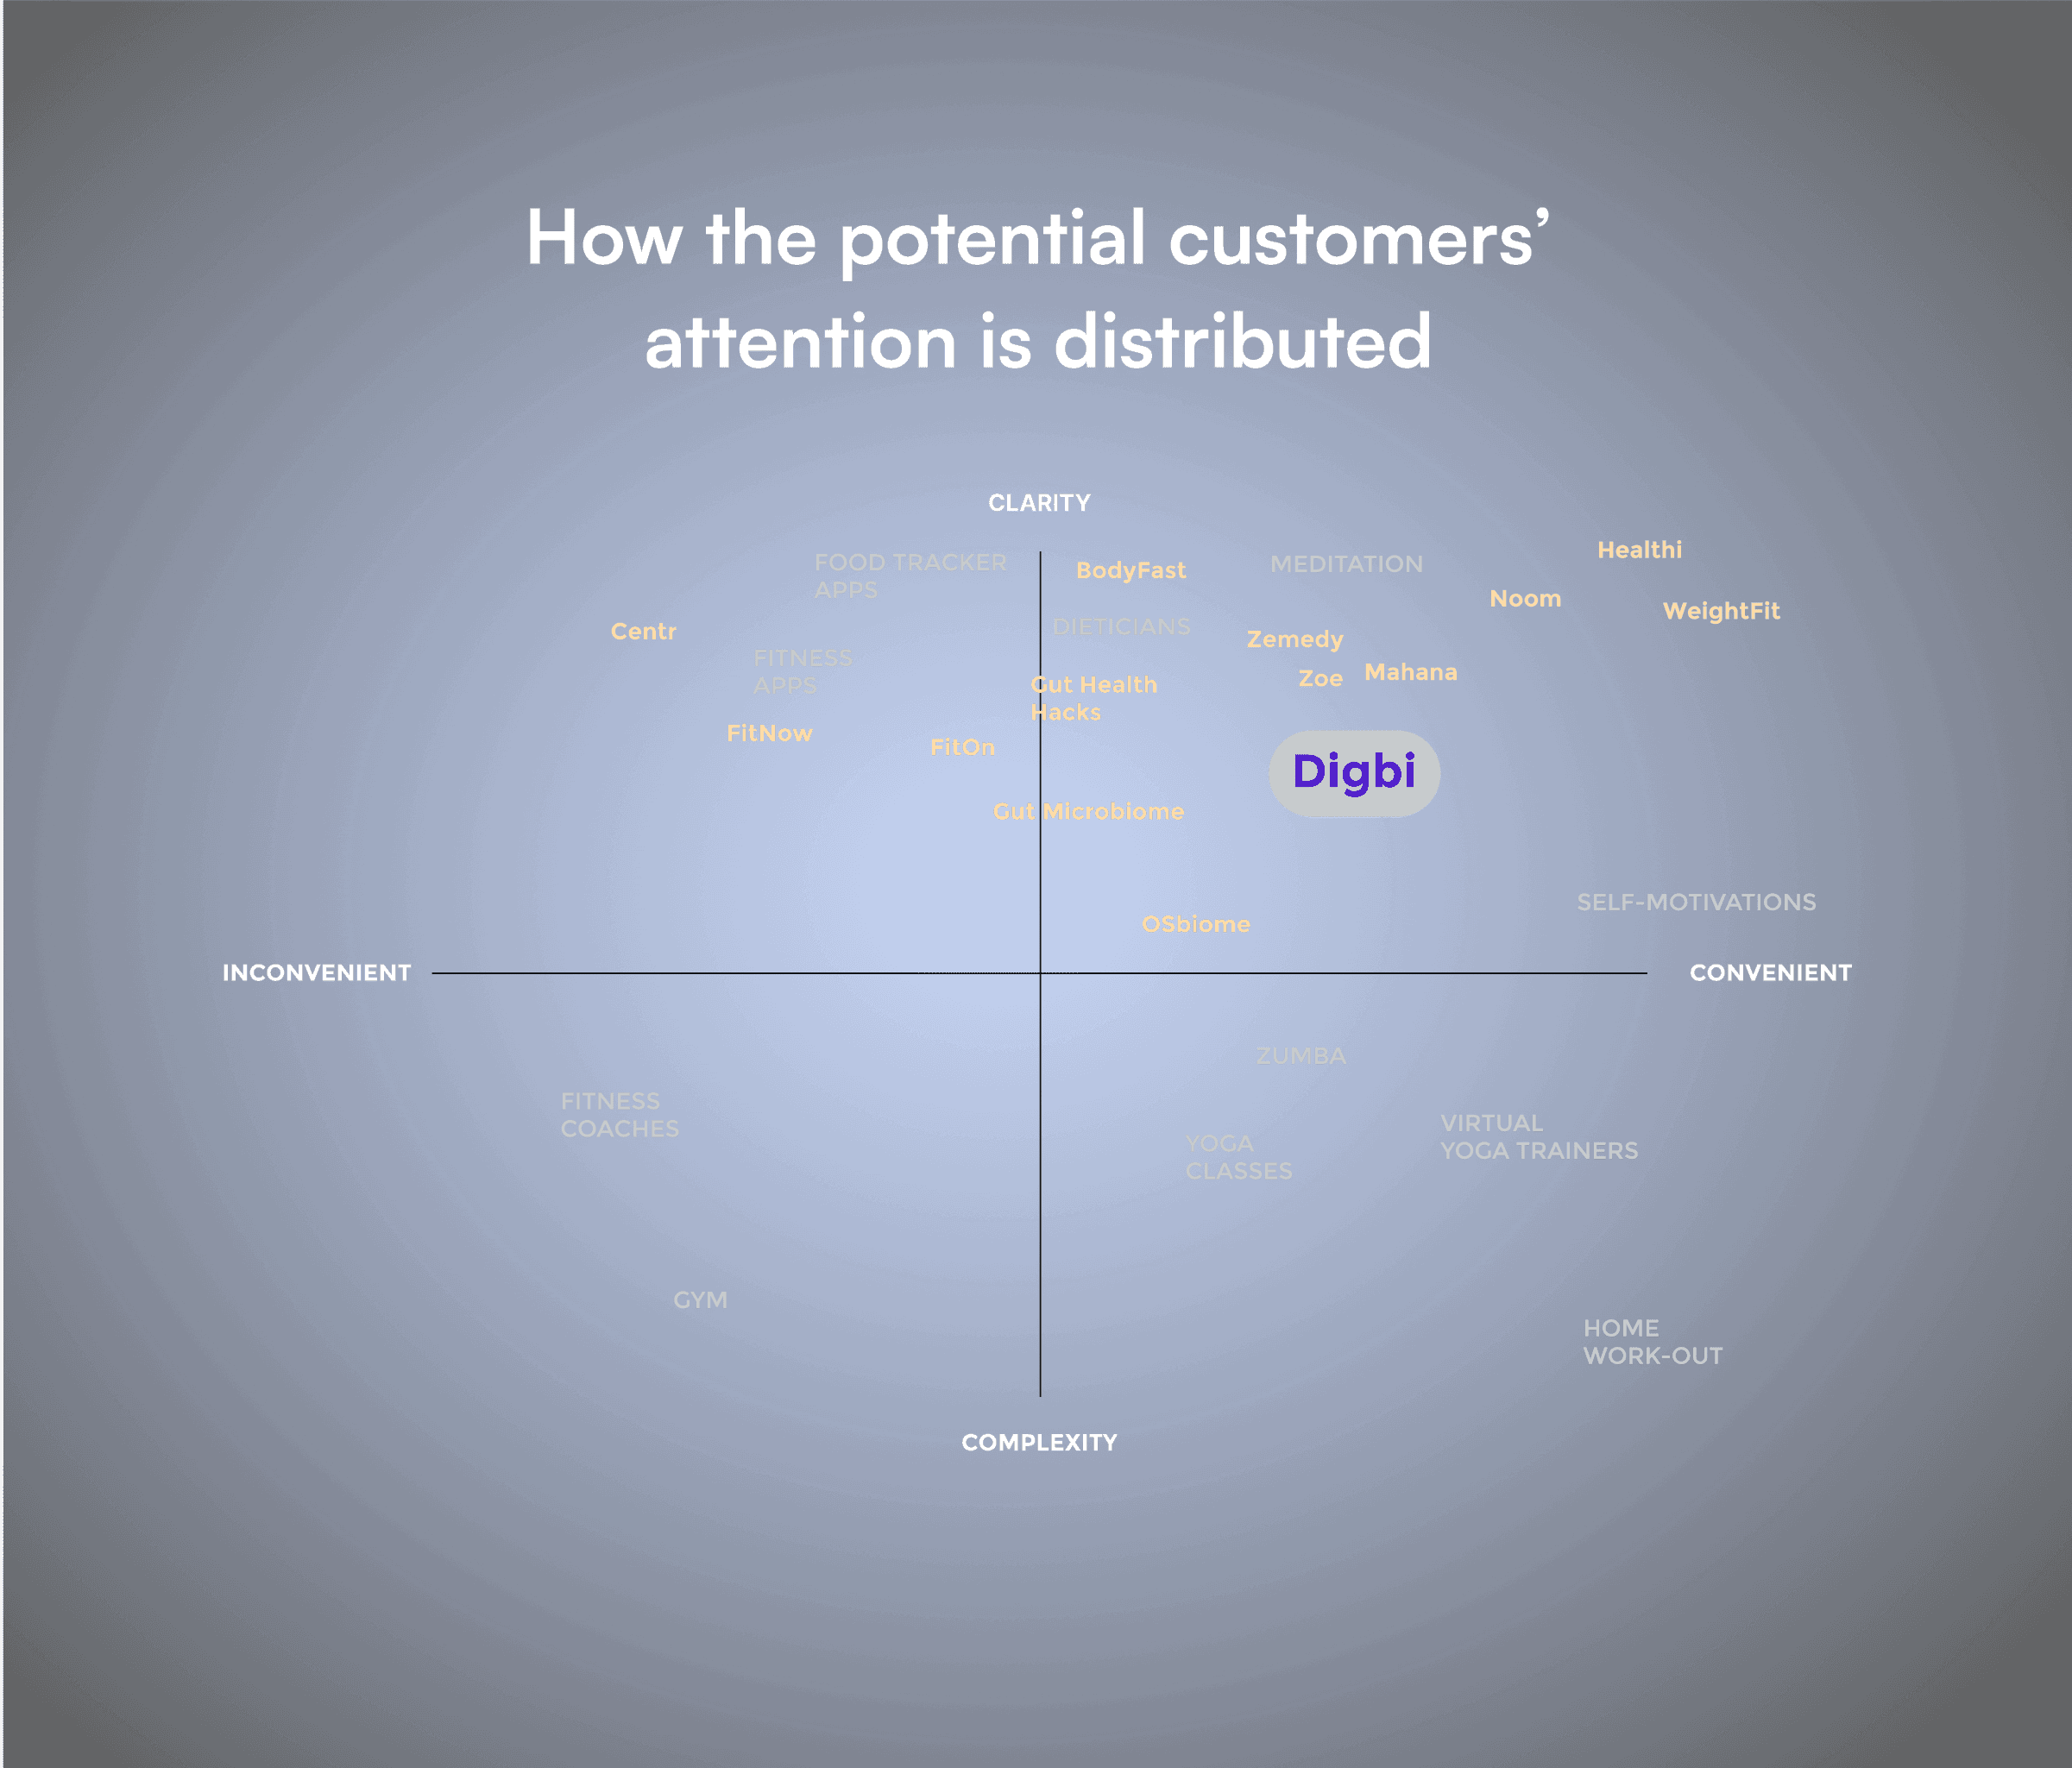
Market Research
The first step was to conducting market research, which was pivotal in delineating the distribution and psychographic profile of Digbi's target audience.
This process afforded a comprehensive understanding of our target audience demographics and behavioural patterns.
Mapping a story (3-Act Story Structure)
Identifying patterns to evaluate their standout features and shortcomings, was instrumental in locating gaps within our own end-to-end experience. This analysis facilitated a targeted approach to refining and enhancing our product offering for optimal user satisfaction.

User Research
I conducted research by collaborating with the social media manager and care specialist to draw out insights and pain points of our users to validate our approach.
👥2 Focus Group Studies
🎦8 User Interviews
📄3 Surveys


Building wireframes & prototypes
I went through several iterations of wireframes as they were used to align the expectations of all the internal stakeholders with a user-centric approach.
Once the wireframes were locked in, I developed a rudimentary prototype to present the vision of this enhanced section of the app.

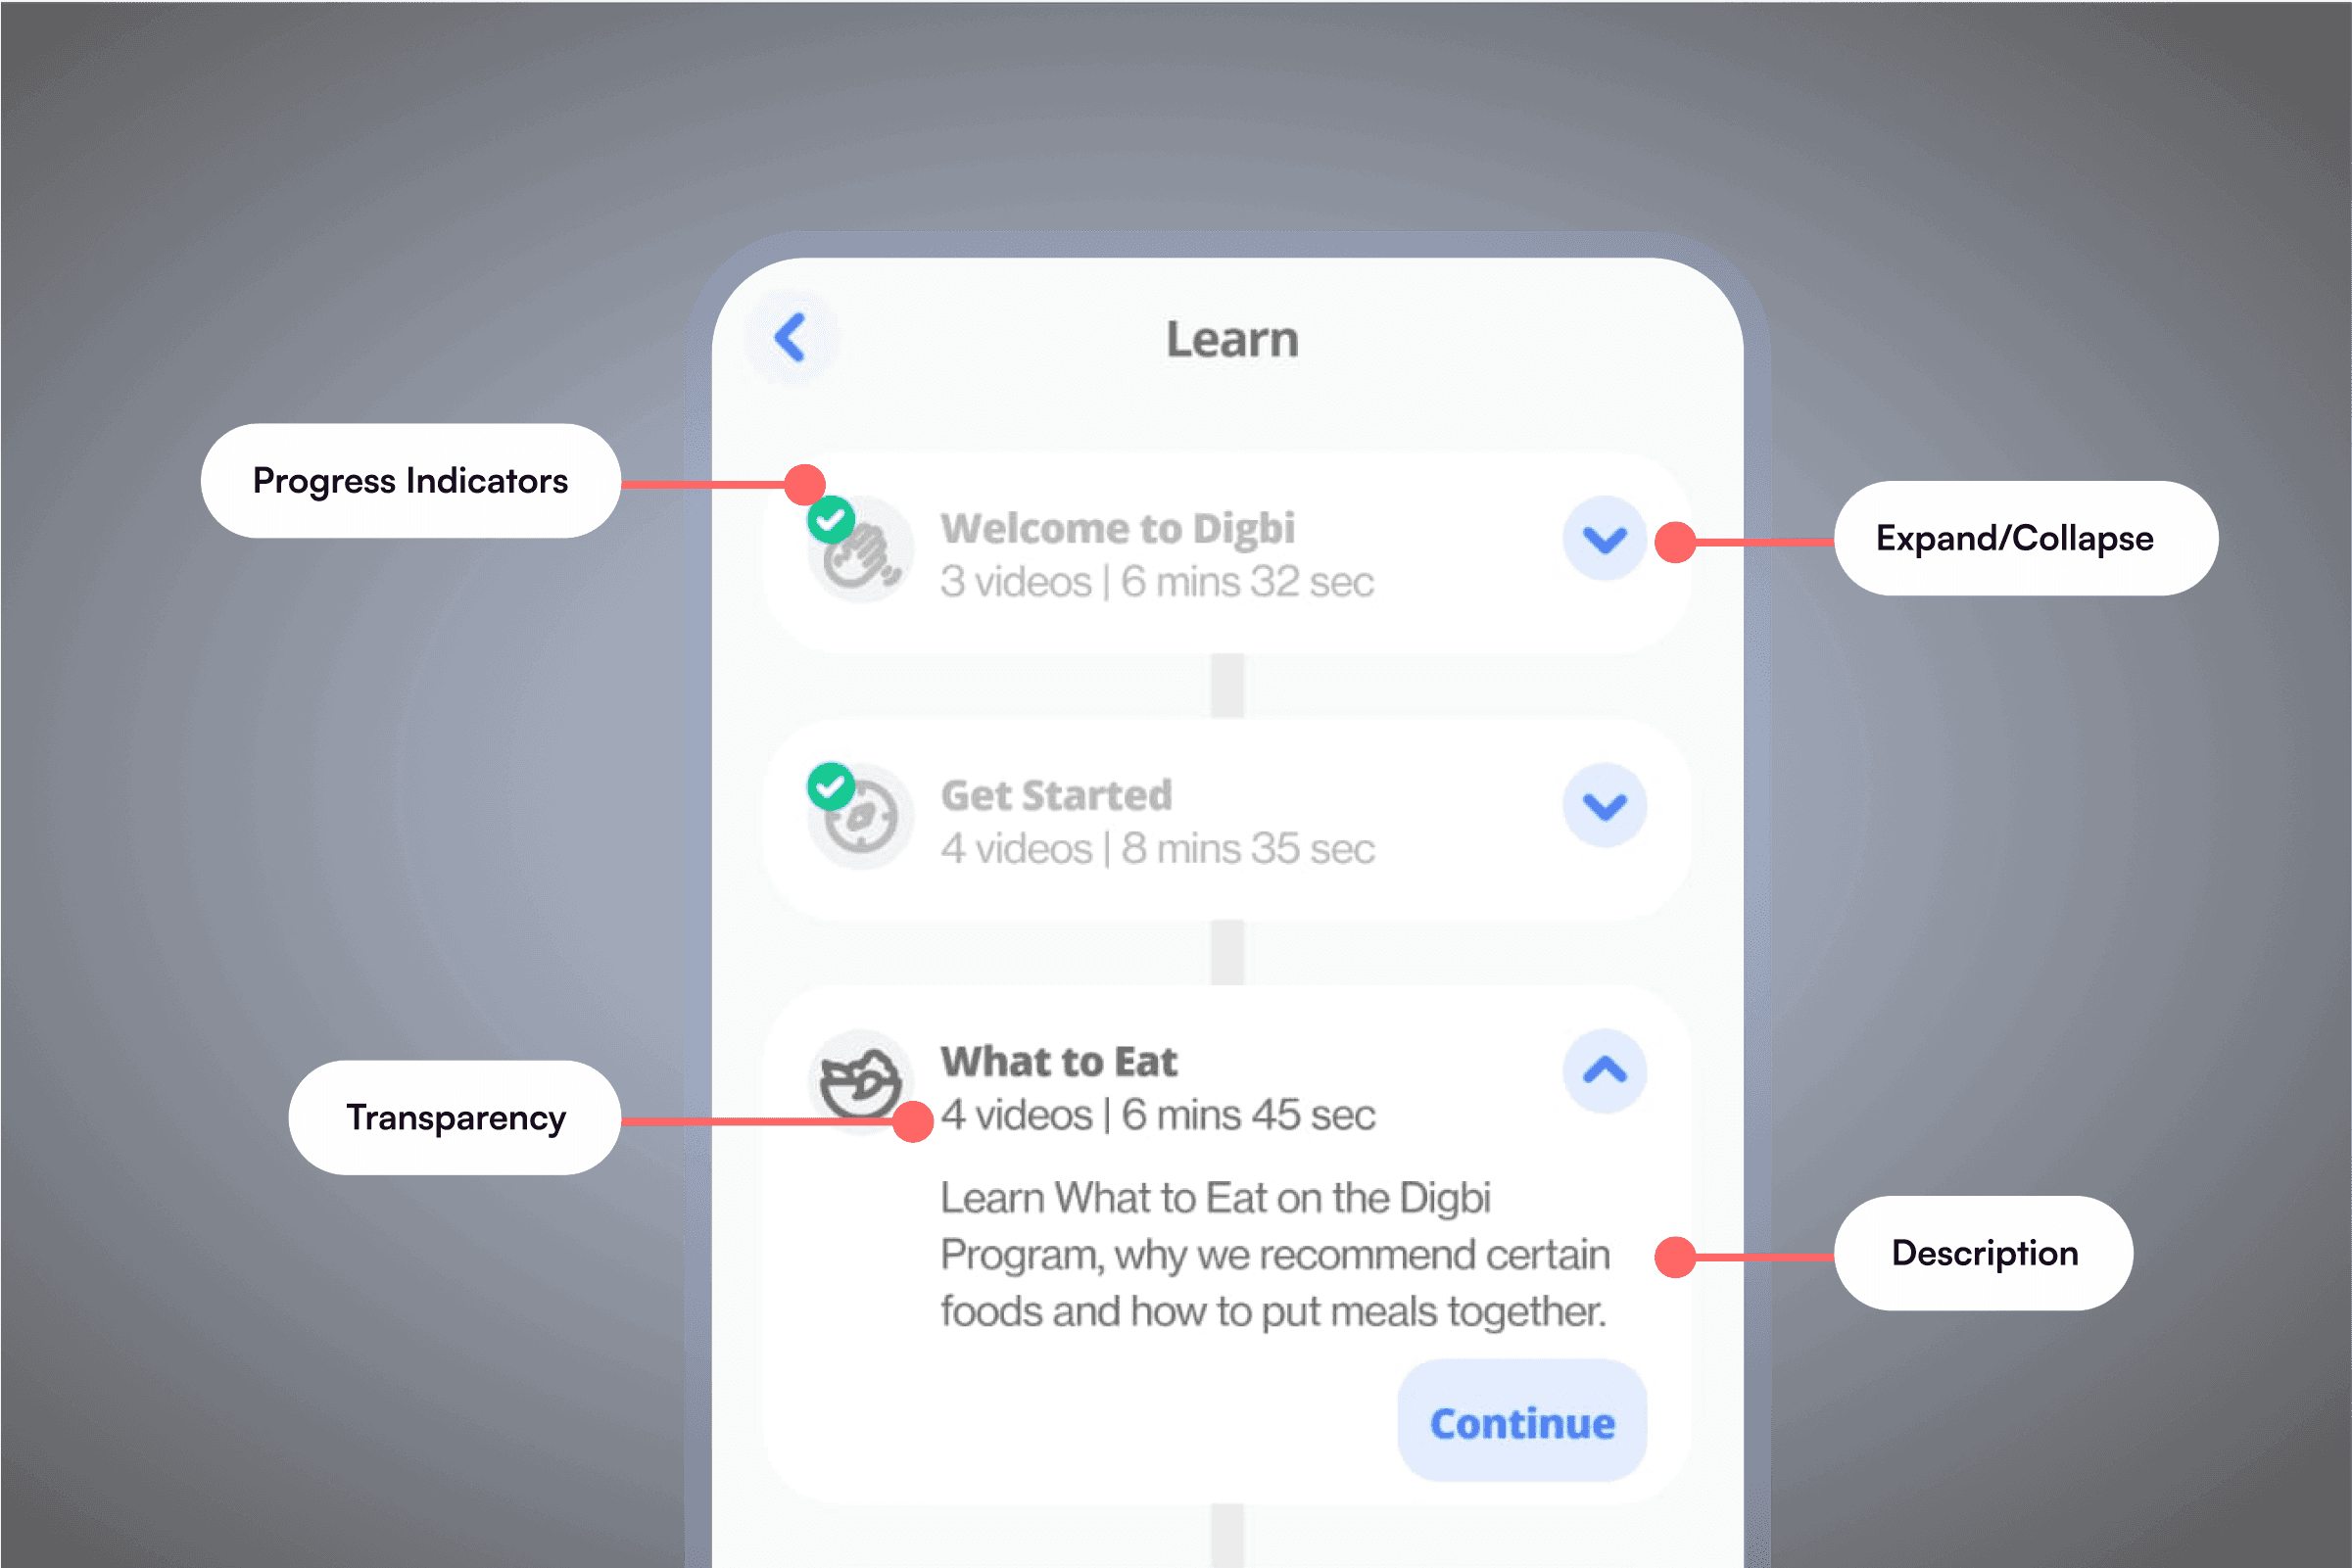
Challenges faced
Any project is incomplete without a few obstacles and I faced some new but some familiar ones myself during this period.
🎦Video Content: Each video spanned about 50-60 mins.
I had to cross-collaborate with the care specialist, social media manager, scientists, content writers and the video production team to ensure that the content is revised in order to meet the expectations of this enhanced section.👥Stakeholder Alignment: Business needs vs User-Centric Approach
I had to conduct workshops and presentations to demonstrate how a balanced approach will benefit both the client needs as well as the end-user needs.
Using a data-driven approach along with the insights from research proved helpful to plead my case and align all the senior stakeholders for this project.🧑💻👩💻Development Effort: Due to limited resources in the team, it was difficult to plan the production of this project.
I had to realign priorities with the Head of Product and Head of Care Team to bring focus to the need of this problem using insights from research stage. That effort helped in planning a product roadmap and including this redesigned effort to the developer's tasks between Q3 2022 - Q2 2023.
Contributing to Design Systems
As a UX Designer, part of my role was also to assist the UI Designer in the team for modifying and enhancing the existing components, as well as the creation of new ones.

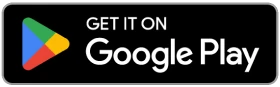
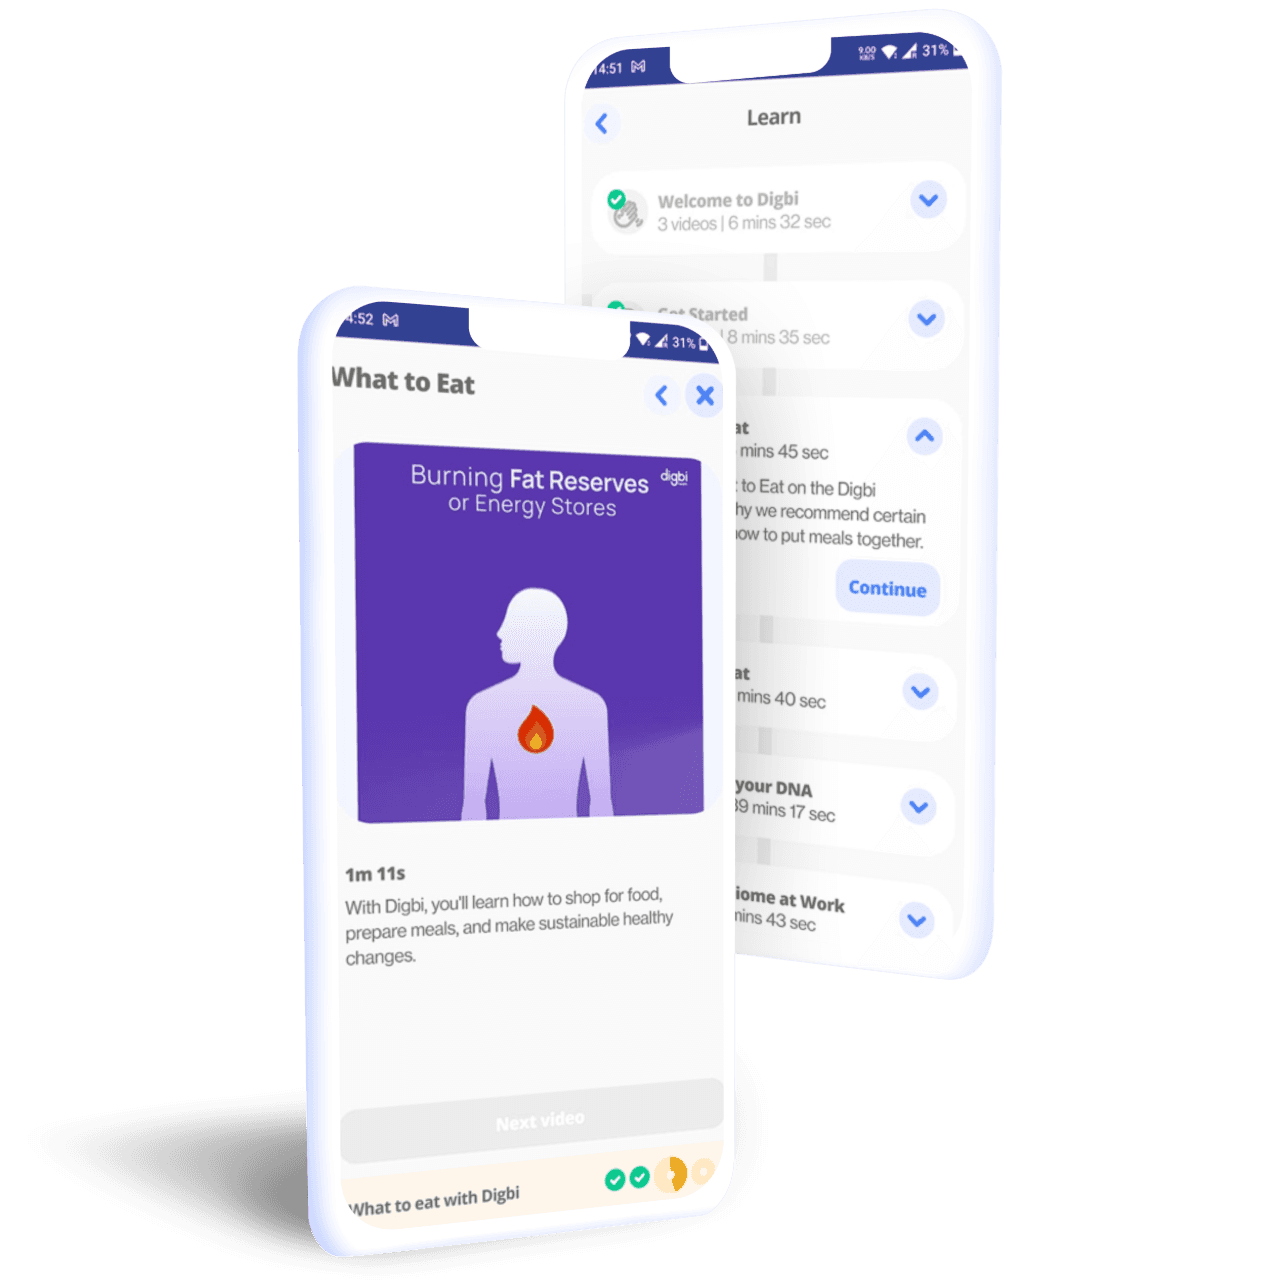
Final Design UI
After locking the prototype with the team, I handed over the flows to the UI Designer to implement all the necessary UI changes. Once the screens were ready, we incorporated the prototype with the final UI designs.

Metrics Tracking
We tracked app engagement time, daily active users, modules explored, and views on videos.
23%
47%
67
Results & Key takeaways
This project demonstrated the power of combining analytics through "Mixpanel" and qualitative feedback from users to drive engagement. User-centered design, informed by UX/UI and psychology principles, was crucial to success.